Best AI ETFs in the Netherlands 2026: 7 Options Compared on Facts
Important upfront: This article is a factual product comparison, not investment advice. Which AI ETF (or combination of ETFs) suits you depends on your personal situation, investment horizon and risk tolerance. Investing involves risk — you may lose (part of) your capital.
Looking for the best AI ETF in the Netherlands for 2026? You’re not alone. Since ChatGPT broke through in late 2022 and companies like NVIDIA, Microsoft, Google and Samsung have poured billions into artificial intelligence, more Dutch-based investors are wondering how they can benefit from this trend — without having to pick individual stocks themselves.
Data freshness: ETF TER, AUM and returns last verified 1 May 2026 (source: justETF.com) · Broker pricing verified 15 May 2026 · Dutch Box 3 assumptions verified April 2026 (source: Belastingdienst).
📋 Quick reference: best AI ETF by objective criterion
VanEck Semiconductor (VVSM)
XAIX / VanEck Semi / iShares AI Infra — 0.35%
Amundi MSCI Robotics & AI — 161 holdings
iShares Automation & Robotics (2B76) only
VanEck Semiconductor (+157%, highest volatility)
iShares AI Infrastructure (AINF)
Ranked by single objective criteria. Which matters most to you depends on your investment goals — this page gives you the facts to decide.
On this page you’ll compare 7 AI ETFs that you can buy as a Netherlands-based investor in 2026. We base everything on current figures from justETF (May 2026) and the official factsheets of Xtrackers, BlackRock, VanEck, Legal & General, WisdomTree and Amundi. No ranking on “quality” or “preference” — just facts on costs (TER), size (AUM), diversification, holdings and historical returns so you can decide yourself.
We also answer a question most comparison sites leave under-covered: do you actually need a dedicated AI ETF if you already own a broad world ETF like VWRL or VWCE? And how does Box 3 taxation apply?
📊 Quick overview of the facts (May 2026)
- Largest by AUM: VanEck Semiconductor (€5.98 bn) and Xtrackers AI & Big Data (€5.78 bn)
- Lowest TER: XAIX, VanEck Semi and iShares AI Infrastructure (0.35%)
- Broadest diversification: Amundi MSCI Robotics & AI (161 holdings)
- Most concentrated: VanEck Semiconductor (25 holdings)
- In DEGIRO Core Selection: only iShares Automation & Robotics (2B76, €1 per trade)
- Highest 1-year return: VanEck Semi (+157% — note: also highest volatility)
- Listed on Euronext Amsterdam: iShares AI Infrastructure (AINF)
Which criterion matters most to you — costs, diversification, broker availability, or historical returns — depends on your investment goals. This page gives you the facts.
AI ETFs are bought through a broker. Compare Dutch brokers on costs, ETF range and ease of use on our broker overview page.
Compare Brokers for Dutch Investors →What is an AI ETF, exactly?
An AI ETF is a listed index fund that invests in a basket of companies active in artificial intelligence. Instead of buying NVIDIA, ASML or Palantir shares individually, you buy one ETF unit and gain exposure to dozens or hundreds of AI-related companies in a single trade.
The ETFs in this comparison fall into three categories:
- Pure AI ETFs — track an AI-themed index (such as Nasdaq Global AI, Nasdaq CTA AI, ROBO Global AI). Contain companies that derive revenue from AI products and services.
- Robotics & AI ETFs — broader than pure AI. Also add industrial robotics companies (ABB, Rockwell, Advantest, Teradyne).
- Semiconductor ETFs — no “AI” in the name, but because NVIDIA, AMD, TSMC, ASML and Broadcom supply the chips on which all AI runs, these ETFs form an indirect AI pure-play. Typically more correlated to “the AI hype” overall.
All 7 ETFs in this comparison are UCITS-compliant (mandatory for Dutch retail investors), accumulating (dividends are automatically reinvested, not distributed), and domiciled in Ireland or Luxembourg. That makes them Box 3-equivalent for tax purposes — more on that further down.
Which facts matter most to you?
Before you dive deeper: below you can see, per criterion, which ETF scores on that point. This is a quick reference — not a ranking on “quality”.
Do you already own AI in your world ETF? How much AI sits in VWRL and VWCE
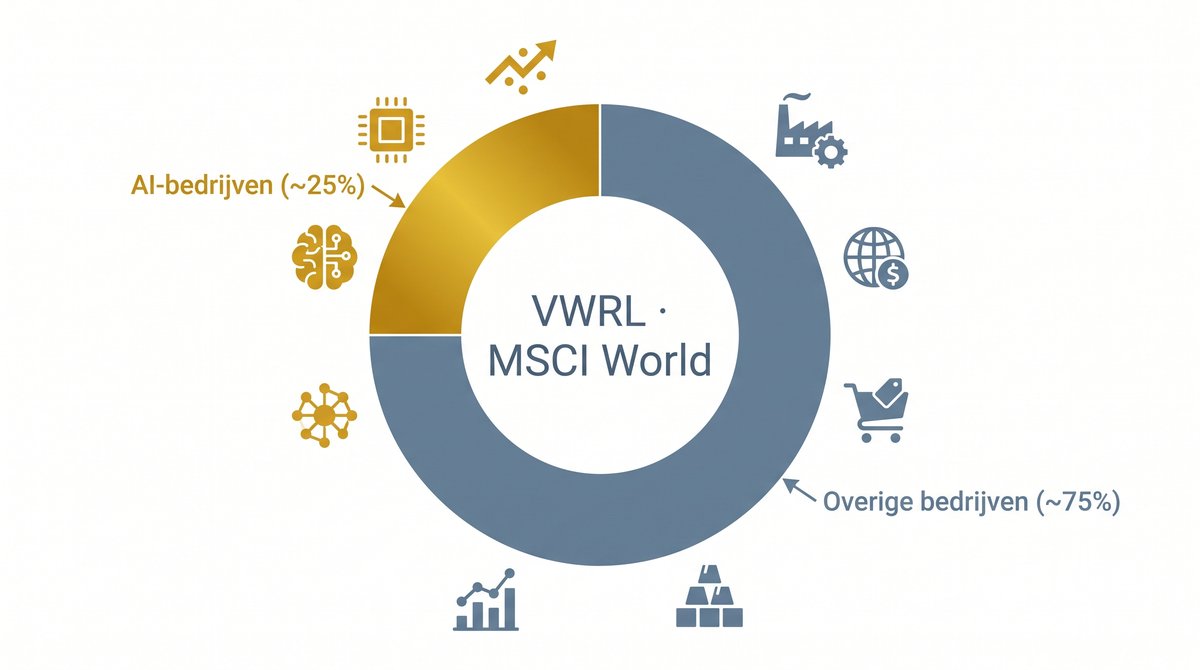
Before buying a dedicated AI ETF, it’s smart to look at what you already own. Many Netherlands-based investors hold a broad world ETF like VWRL (Vanguard FTSE All-World) or VWCE (Vanguard FTSE All-World Accumulating) in their portfolio. These ETFs hold more than 3,500 companies worldwide — and a significant portion of that is already AI exposure.
According to the official Vanguard FactSheet (May 2026), VWRL’s top 10 holdings consist largely of AI leaders:
| Company in VWRL top 10 | ~Weight | AI relevance |
|---|---|---|
| NVIDIA | ~5.5% | AI chip market leader |
| Microsoft | ~4.2% | OpenAI partner, Azure AI, Copilot |
| Apple | ~3.8% | On-device AI (Apple Intelligence) |
| Alphabet (Google) | ~3.0% | Gemini, DeepMind, Google Cloud AI |
| Amazon | ~2.5% | AWS, Anthropic partner |
| Meta | ~2.0% | LLaMA, AI infrastructure |
| Broadcom | ~1.7% | AI networking chips, custom AI silicon |
| TSMC | ~1.5% | Chip fabricator for all AI players |
Added together, you already hold roughly 20-25% in direct AI leaders via a world ETF — and that’s before counting the second layer (ASML, AMD, Micron, Palantir, Oracle, Cisco). The difference with a dedicated AI ETF isn’t whether you have AI exposure, but how concentrated that exposure is and which specific AI niche you emphasise.
What a dedicated AI ETF adds on top of your world ETF:
- Specific AI names you barely have in a world ETF: Palantir, Palo Alto Networks, Lumentum, Advantest, Cognex, Teradyne, MediaTek
- Asian AI companies with higher weighting: Samsung and SK Hynix (memory chip leaders for AI) appear in VWRL at less than 1% but in WTAI at 2.64% and 7.38% respectively
- Increased concentration in the companies that may benefit most from AI growth — at the cost of broader diversification
For someone curious about AI but already holding a world ETF, this becomes a trade-off: extra concentration (and the additional risk that comes with it) in exchange for more specific thematic exposure. There’s no right or wrong answer — it depends on your investment goal.
The 7 Best AI ETFs in the Netherlands — Full Comparison
Below you’ll find the seven AI ETFs included in this comparison, ranked by AUM (assets under management) — from largest to smallest. AUM is an objective criterion: larger funds typically offer better liquidity and lower delisting risk, which matters for long-term investing.
Selection criteria: UCITS-compliant, AUM at least €400M, track record at least 2 years (one exception explained), thematic relevance to AI / semiconductor / robotics. ETFs that didn’t make the selection — and why — are listed at the bottom of this page.
Comparison table — key figures
| ETF | ISIN | TER | AUM | Holdings | 1yr | YTD ’26 | Vol 1yr |
|---|---|---|---|---|---|---|---|
| VanEck Semiconductor | IE00BMC38736 | 0.35% | €5.98 bn | 25 | +157.41% | +64.34% | 30.77% |
| Xtrackers AI & Big Data (XAIX) | IE00BGV5VN51 | 0.35% | €5.78 bn | 89 | +50.38% | +6.98% | 17.19% |
| iShares Automation & Robotics (2B76) | IE00BYZK4552 | 0.40% | €3.80 bn | 133 | +37.28% | +14.37% | 17.85% |
| L&G AI (AIAI/XMLD) | IE00BK5BCD43 | 0.49% | €1.42 bn | 50 | +61.47% | +11.74% | 24.04% |
| Amundi MSCI Robotics & AI (GOAI) | LU1861132840 | 0.40% | €0.95 bn | 161 | -1.62% | -2.79% | 23.63% |
| WisdomTree AI (WTAI/WTI2) | IE00BDVPNG13 | 0.40% | €0.86 bn | 63 | +26.02% | -2.68% | 28.24% |
| iShares AI Infrastructure (AIFS/AINF) | IE000X59ZHE2 | 0.35% | €0.41 bn | 44 | +24.66% | +3.72% | 25.90% |
Source: justETF.com official profile pages as of May 2026. All ETFs are accumulating (no dividend distribution) and UCITS-compliant.
Below you’ll find details per ETF: what it tracks, what’s inside it, how it has performed historically, and at which broker you can buy it.
Historical Returns and Volatility: What the Numbers Show
Below are the annual performances of all 7 ETFs (2022 through May 2026), color-coded: 🟢 green = positive, 🔴 red = negative, darker = larger absolute move. This is the same data other Dutch comparison sites often don’t show in full — specifically the 2022 drawdown.
Key observations:
- 2022 was brutal for every AI ETF: losses of -20% (Amundi GOAI, the most defensive) to -38% (WTAI). For context: a world ETF like VWRL fell roughly -13% that year. AI ETFs have historically been two to three times more volatile than a broad world ETF.
- 2023 saw a strong recovery: +25% to +67% within a single calendar year. Anyone who bought in January 2022 and didn’t sell was back in the green by early 2024.
- Recent performance diverges sharply: in YTD 2026, the spread runs from -2.79% (Amundi GOAI) to +64.34% (VanEck Semi). Not all “AI ETFs” behave alike — the semiconductor pure-play has a very different risk and return profile than a broadly diversified robotics ETF.
- Maximum drawdowns range from -30% to -43%: that’s the worst-case paper loss an investor would have seen at some point. On a €10,000 investment, that’s between €3,000 and €4,300 in unrealized losses at the lowest point.
AI ETFs are not a substitute for a broadly diversified core portfolio. They’re a thematic addition with high volatility and above-average drawdowns. How much you allocate to such a theme is a personal choice based on your investment horizon, risk tolerance, and existing portfolio composition.
Risk vs return — 7 AI ETFs visualized
Each dot represents one ETF. Vertical position = 1-year return. Horizontal position = 1-year volatility. Higher = more return, further right = more price movement (risk). Dots top-right = high return but also high volatility.
What the chart shows: VanEck Semiconductor has the highest 1-year return (+157%) but also the highest volatility (30.8%). XAIX and 2B76 have the lowest volatility (~17%) with decent returns (+50% and +37%). Amundi GOAI is the only one below the 0% line despite average volatility — an outlier this year. No ETF combines low risk with extreme returns — a logical trade-off you see in every stock market.
Box 3 and AI ETFs: How They’re Taxed in the Netherlands
For Netherlands-based retail investors, ETFs fall under Box 3 (savings and investments). In 2026:
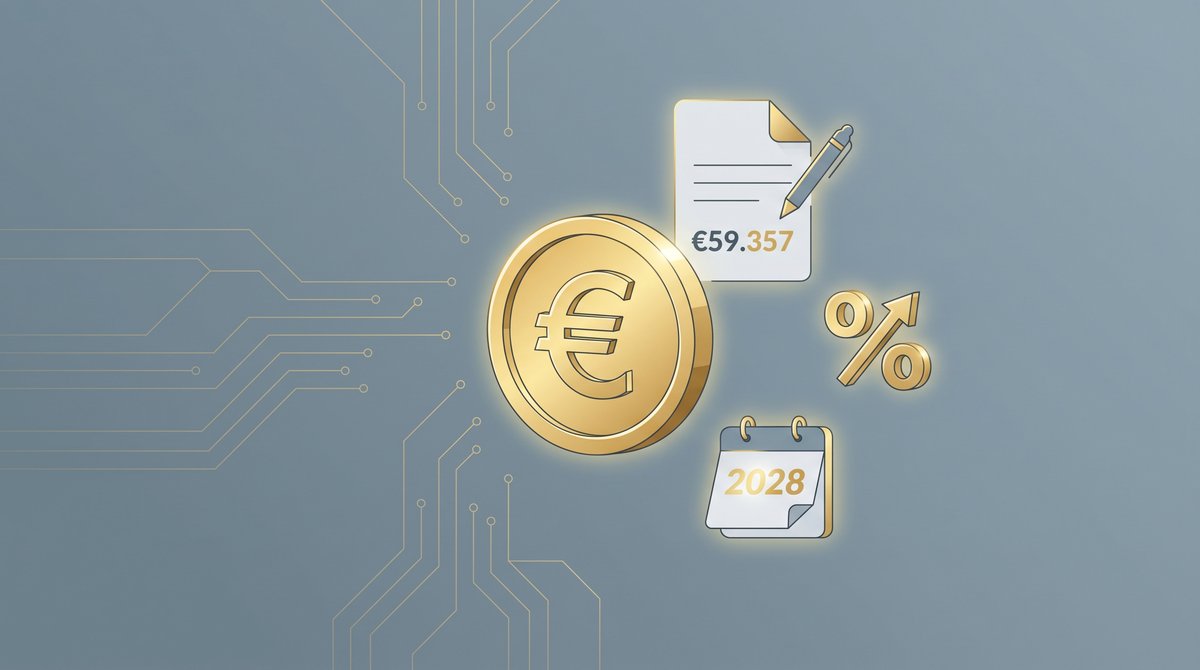
- Tax-free allowance (heffingsvrij vermogen): €59,357 per person, €118,714 for tax partners (source: Belastingdienst)
- Fictitious return on “other assets” (including ETFs): 6.00% in 2026
- Tax rate: 36% on the fictitious return (in 2026)
A worked example: suppose you have €30,000 invested in AI ETFs plus €40,000 in savings. Your total Box 3 assets are €70,000, less the €59,357 allowance = €10,643 taxable. A fictitious return of about 6% is calculated on this (€639), of which 36% is tax (~€230). You’d pay roughly €230 in tax in 2026 on your investment assets, regardless of whether your AI ETFs went up 60% or down 30%.
Real Returns Tax Act from 2028
On 12 February 2026, the Dutch parliament passed the Wet werkelijk rendement (Real Returns Tax Act). From 1 January 2028, Box 3 will be reformed into a system that taxes actual returns instead of a fixed percentage. For AI ETF investors that means: in strong years (like VanEck Semi’s +157% in 2024-2025) you’ll pay more tax, in weak years (like 2022) less or possibly nothing. Follow our investing taxes page for the latest updates.
Dividend withholding tax
All 7 ETFs in this comparison are accumulating: dividends aren’t paid out but reinvested inside the fund. This has tax implications: no Dutch dividend withholding tax is deducted on your account — the returns are reflected in a higher ETF unit price instead. The funds are domiciled in Ireland (6 ETFs) or Luxembourg (Amundi GOAI); for Box 3 purposes, this distinction has no practical effect.
Where Can You Buy AI ETFs in the Netherlands?
The broker you use determines how much you pay to buy an AI ETF. Below is a factual comparison of the three brokers most commonly used by Netherlands-based investors, and how they price these 7 AI ETFs.
DEGIRO
Offers all 7 ETFs at regular order rates. One ETF is in the Core Selection (Tradegate, €1 per trade): iShares Automation & Robotics (2B76). The other 6 cost more — typically €1 + 0.03% (Tradegate) or €3-5 (Euronext Amsterdam/Xetra) depending on the exchange. For monthly investing, 2B76’s Core Selection status is a meaningful cost advantage.
eToro
Offers commission-free ETF investing (0% commission). eToro does charge 0.5% currency conversion on every EUR→USD deposit, as the platform operates in USD. On a €1,000 investment, that’s €5 in conversion costs in addition to any spread. For occasional lump-sum buys it may be cheaper than DEGIRO; for monthly DCA the FX costs add up. Availability of the specific 7 ETFs varies — check the eToro search function.
Trade Republic
For all 7 ETFs, a monthly ETF savings plan is available commission-free, starting from €1 per month. Outside the savings plan, a manual order costs €1 per trade. For systematic monthly investing in the same AI ETF, this is the lowest-cost platform of the three.
Cost overview: buying an AI ETF via the 3 brokers
What does one €1,000 purchase of 2B76 (DEGIRO Core Selection ETF) or another AI ETF cost at the three brokers most commonly used by Netherlands-based investors?
51% of retail investor accounts lose money when trading CFDs with this provider. This percentage applies to eToro’s CFD product, not to stock and ETF trading. Investing involves risk — you may lose part of your invested capital.
Rates as of May 2026. At DEGIRO, exchanges other than Tradegate (e.g. Euronext Amsterdam, Xetra) carry higher fees. Availability of specific ETFs varies per broker — verify before opening.
Invest commission-free in ETFs via eToro. eToro charges 0% commission on ETF trades; only 0.5% currency conversion on EUR→USD deposits.
Open an eToro Account →51% of retail investor accounts lose money when trading CFDs with this provider. This percentage applies to eToro’s CFD product, not the stock and ETF trading relevant to this article.
Monthly investing in an AI ETF? Trade Republic offers commission-free savings plans starting at €1 per month on all 7 ETFs in this comparison. EUR-native account — no currency conversion needed.
Open a Trade Republic Account →Investing involves risk — you may lose (part of) your capital. Past performance is no guarantee of future results.
Compare all Dutch brokers on costs, ETF range and ease of use in our comprehensive broker overview.
Full Broker Comparison →Interested in eToro specifically? Read our in-depth review of eToro for Netherlands-based investors.
eToro Review Netherlands →51% of retail investor accounts lose money when trading CFDs with this provider. This applies to eToro’s CFD product, not the stock and ETF trading discussed in this article.
ETFs That Didn’t Make the Selection — And Why
There are a total of 17 pure AI UCITS ETFs, plus several semiconductor and robotics ETFs. We included 7 in detail in this comparison. The others didn’t meet our objective selection criteria (AUM ≥ €400M, track record ≥ 2 years, UCITS, sufficient thematic relevance). For completeness, here are the ETFs we excluded and why:
- Global X Robotics & Artificial Intelligence (BOTZ) — AUM €92M (too small, liquidity risk). Often mentioned in older Dutch comparison articles.
- iShares AI Innovation Active — launched 2025, too short a track record. Also higher TER (0.73%) due to active management.
- iShares AI Adopters & Applications — AUM €185-291M, below our threshold.
- ARK Artificial Intelligence & Robotics — AUM €259M, high TER (0.75%), <2yr track record.
- WisdomTree Physical AI, Humanoids and Drones — brand new (2025), AUM €57M.
- Various very small ETFs (Global X AI, Invesco Enablers, Franklin AI/Metaverse, TEQ General AI, Global X AI Semiconductor & Quantum, Defiance AI, Lunate Boreas S&P AI): all <€100M AUM and/or too recent.
For those who want to explore further, justETF’s AI ETF overview offers the full list of 17 ETFs.
Frequently Asked Questions about the Best AI ETF in the Netherlands
What is the best AI ETF in the Netherlands in 2026?
There isn’t one “best” AI ETF that works for everyone — which one fits depends on what you value. Ranked by AUM, VanEck Semiconductor (VVSM) tops the list at €5.98 billion, followed by Xtrackers AI & Big Data (XAIX, €5.78 bn) and iShares Automation & Robotics (2B76, €3.80 bn). For the lowest TER, XAIX, VanEck Semi and iShares AI Infrastructure share first place at 0.35%. For broadest diversification, Amundi MSCI Robotics & AI (GOAI) has 161 holdings. For DEGIRO Core Selection, iShares Automation & Robotics (2B76) is the only option. Assess for yourself which criterion matters most.
Do I need a dedicated AI ETF if I already own a world ETF like VWRL?
Not necessarily. A broad world ETF like VWRL or VWCE already contains roughly 20-25% AI leaders (NVIDIA, Microsoft, Apple, Alphabet, Amazon, Meta, Broadcom, TSMC). What a dedicated AI ETF adds is increased concentration in specific AI niches and exposure to AI-related companies that are under-represented in a world ETF (like Palantir, Palo Alto Networks, Advantest, SK Hynix). The trade-off is extra concentration risk in exchange for more specific thematic exposure.
How risky are AI ETFs compared to a world ETF?
AI ETFs have historically been considerably more volatile. In 2022 all 7 AI ETFs compared here fell between -20% and -38%, while a broad world ETF like VWRL fell roughly -13% — so 1.5 to nearly 3 times the magnitude. Current 1-year volatility ranges from 17% (XAIX, 2B76) to 31% (VanEck Semi). Maximum historical drawdowns range from -30% to -43%. For long-term wealth building, AI ETFs are a thematic supplement with a high-risk profile, not a core portfolio component.
Which AI ETF can I buy via DEGIRO Core Selection?
Of the 7 ETFs in this comparison, only iShares Automation & Robotics (ticker 2B76, ISIN IE00BYZK4552) is in the DEGIRO Core Selection. That means you can buy it for €1 per transaction via Tradegate, instead of the €3 to €5 DEGIRO charges for regular ETFs. For monthly investing, that’s a meaningful cost difference.
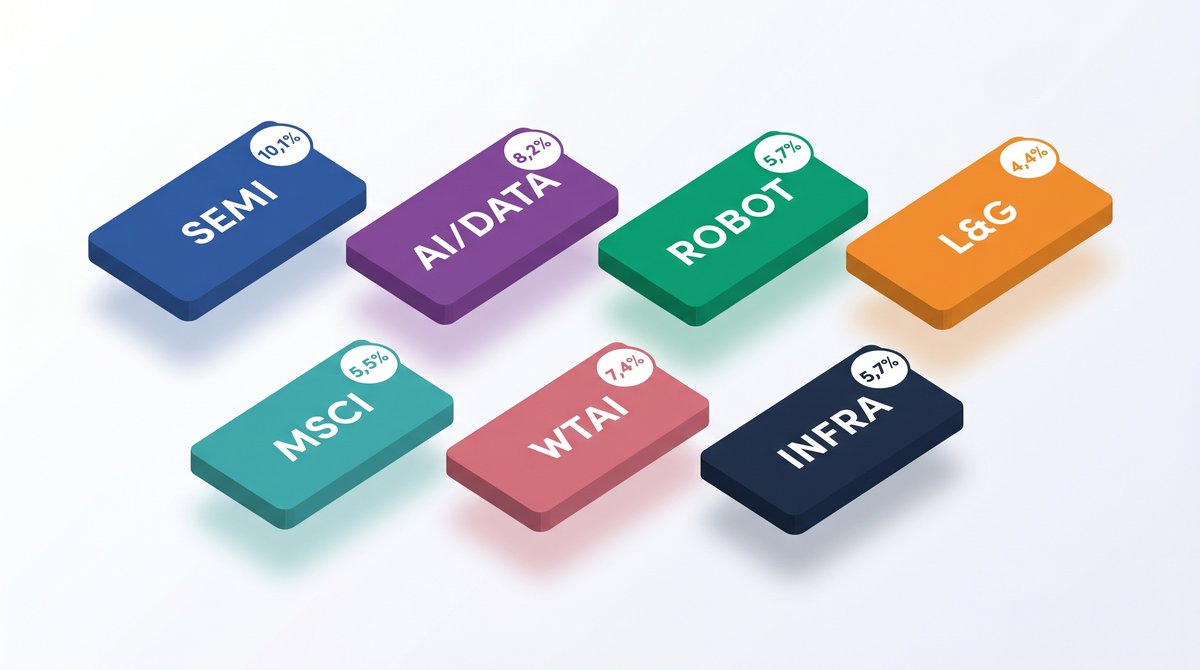
Which AI ETF has the most NVIDIA exposure?
VanEck Semiconductor (VVSM/SMH) has the highest NVIDIA weighting in this comparison: 9.92% (Mar 2026). Other ETFs follow with: iShares AI Infrastructure (NVIDIA in top 10), Amundi MSCI Robotics & AI (4.07%), Xtrackers AI & Big Data (4.44%), iShares Automation & Robotics (3.20%), and WisdomTree AI (2.46%). For maximum NVIDIA exposure without buying the stock directly, VanEck Semi delivers it most.
How much tax do you pay on AI ETFs in the Netherlands?
AI ETFs fall under Box 3 (savings and investments). In 2026, there’s a tax-free allowance of €59,357 per person (€118,714 for tax partners). Above the allowance, a fictitious return of 6.00% is calculated on “other assets” (including investments), taxed at 36%. From 1 January 2028, this system will be replaced by the Wet werkelijk rendement (Real Returns Tax Act), which taxes actual returns. All 7 ETFs in this comparison are accumulating, UCITS-compliant, and domiciled in Ireland or Luxembourg.
What’s the difference between an AI ETF and a semiconductor ETF?
A pure AI ETF (like XAIX or WTAI) follows companies that actively deliver AI products and services: software, models, cybersecurity. A semiconductor ETF (like VanEck Semi) follows chip manufacturers themselves: NVIDIA, AMD, TSMC, ASML, Micron, Intel. Because all modern AI runs on these chips, semiconductor ETFs offer indirect but highly focused AI exposure with generally higher volatility and stronger correlation to the AI hype cycle.
Does an AI ETF contain SK Hynix and Samsung (Korean memory-chip leaders)?
Yes — particularly WisdomTree AI (WTAI) and Xtrackers AI & Big Data (XAIX) have SK Hynix and Samsung strongly represented. WTAI has SK Hynix as its largest position (7.38%) and Samsung at 2.64% — together 10%. XAIX has Samsung at 8.22% (#1) and SK Hynix at 5.21% (#3) — together 13.43%. These Korean memory-chip leaders benefit from the AI trend because their HBM (high-bandwidth memory) chips are essential for AI accelerators. In a broad world ETF like VWRL, Samsung and SK Hynix together typically hold <1% weighting.
Can I buy AI ETFs through a savings plan (DCA)?
Yes — all 7 ETFs in this comparison are available through Trade Republic’s monthly savings plan starting at €1 per month commission-free. At DEGIRO you can buy 2B76 (DEGIRO Core Selection) cheaply at regular intervals via standard orders. eToro doesn’t offer an automated savings plan in the same form. For dollar-cost-averaging strategies (fixed amount per month), Trade Republic is generally the lowest-cost platform.
What was the worst historical performance of AI ETFs?
2022 was the worst year in recent AI ETF history. All 7 ETFs compared here lost between -20% (Amundi GOAI, most defensive) and -38% (WTAI, weakest). Maximum drawdowns since inception range from -30% to -43%. Anyone who bought in January 2022 was back in the green by early 2024, but had to endure a 30-40% paper loss in between without panic-selling.
Conclusion: Which Facts Matter to You?
The best AI ETF in the Netherlands depends on what you value most:
- If low cost is decisive: XAIX, VanEck Semi and iShares AI Infrastructure share first place at 0.35% TER.
- If broad diversification matters: Amundi MSCI Robotics & AI (GOAI) has 161 holdings; iShares Automation & Robotics (2B76) has 133.
- If you want to leverage DEGIRO Core Selection: only 2B76 qualifies, at €1 per trade.
- If you want maximum semiconductor / NVIDIA exposure: VanEck Semi (VVSM) with 25 holdings and NVIDIA at 9.92%.
- If you want SK Hynix and Samsung exposure (Korean memory-chip leaders): WTAI and XAIX represent these strongest.
- If you want monthly investing through a commission-free savings plan: Trade Republic supports all 7 ETFs from €1/month.
- If you want a direct Dutch exchange listing: iShares AI Infrastructure (AINF) on Euronext Amsterdam.
When in doubt or for a specific personal situation, consult a certified financial advisor. This page is a factual comparison, not personalised investment advice.
Ready to start? First compare which Dutch broker fits your investing approach.
Best Brokers for Dutch Investors →Not sure about the basics? First read our beginner’s guide to how ETFs work.
Best ETF for Beginners in the Netherlands →